
Housing Market Indicators Every Reader Should Know

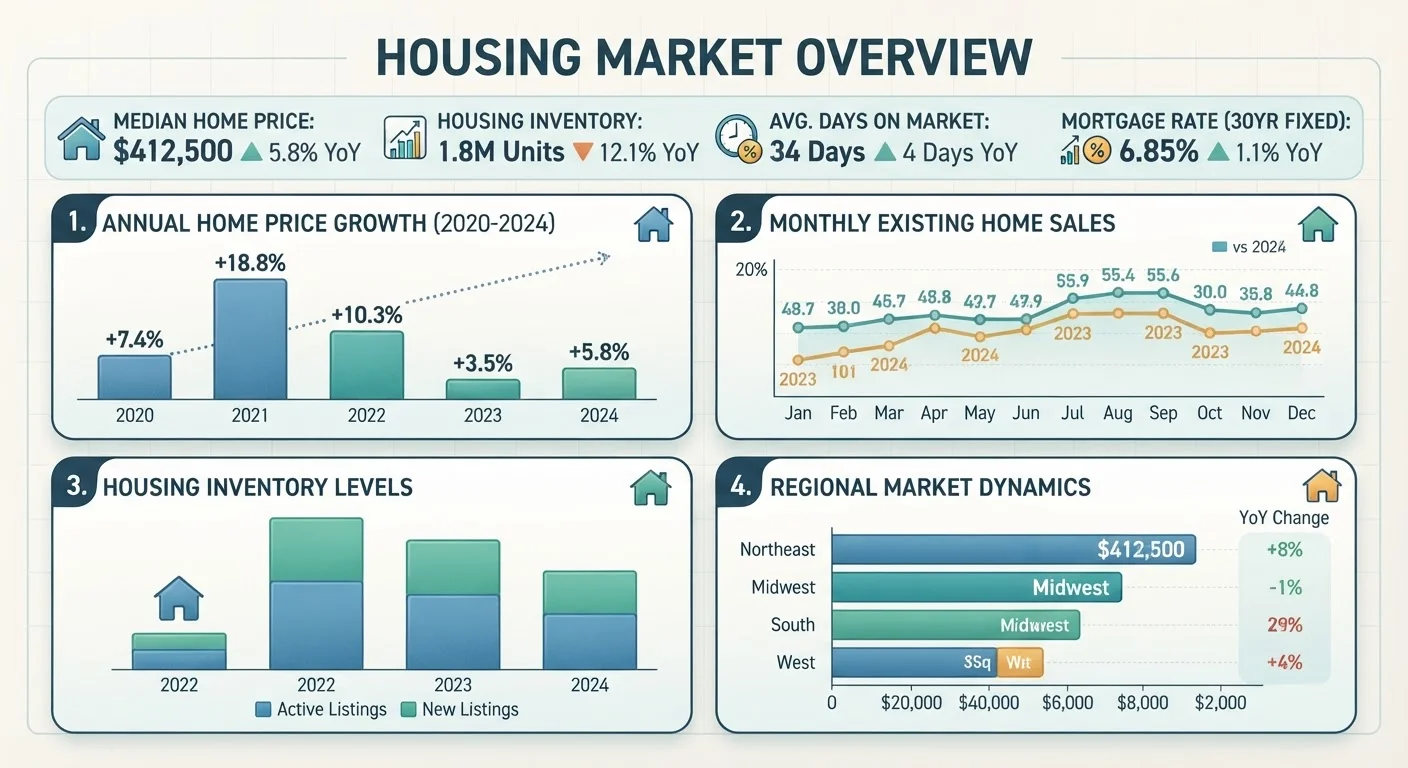
Photo: TheSearchHound.com | One Stop Answer To All Your Questions editorial
Why These Indicators Matter
When housing headlines flood the news, the numbers behind them can feel abstract. But a handful of core metrics - consistently tracked by the National Association of Realtors (NAR), the U.S. Census Bureau, and local multiple listing services - tell a clear story about whether a market favors buyers, sellers, or sits somewhere in between.
Understanding these indicators doesn't require a background in economics. It requires knowing what each number measures and what shifts in that number actually signal. Whether you're considering a purchase, a sale, or watching a local rental market, these are the data points worth tracking. For a deeper look at how these figures come together in published reports, see our guide to reading a housing market report.
The Core Metrics Explained
Housing Inventory refers to the total number of homes listed for sale in a given area at a point in time. It's often expressed as months of supply - how long it would take to sell all current listings at the existing pace of sales. Conventionally, roughly six months of supply suggests a balanced market; below that typically favors sellers, above it favors buyers. Supply and demand dynamics drive nearly every price trend in real estate.
Days on Market (DOM) measures how long a listing sits before going under contract. A falling DOM signals strong demand; a rising DOM often precedes price reductions. Watch for the difference between original DOM and cumulative DOM - the latter resets when a relisted property gets a new MLS entry, which can obscure how long a home has actually been available.
Median Sale Price is the midpoint price across all closed sales in a period - half sold above, half below. It's more resistant to distortion by a few extreme sales than the average (mean) price. Median vs. average price is a meaningful distinction that most reports gloss over.
Sale-to-List Price Ratio shows what buyers are actually paying relative to asking price. A ratio above 100% signals competitive bidding; significantly below 100% indicates negotiating leverage for buyers.
Pending Home Sales track contracts signed but not yet closed - a leading indicator that forecasts closed sales one to two months ahead. Because it reflects current buyer activity rather than past closings, it tends to reveal turning points earlier than closed-sale data.
Months of Supply
The number of months it would take to sell all current listings at the current rate of sales. A figure below six generally indicates a seller's market; above six generally favors buyers.
Days on Market (DOM)
The number of days a property is listed before a purchase contract is signed. Lower DOM typically signals high demand; rising DOM can signal a softening market.
Median Sale Price
The midpoint of all home sale prices in a given period - half of sales occurred above this price and half below. It is less influenced by extreme high or low sales than the average price.
Sale-to-List Price Ratio
The percentage of the asking price that a home actually sells for. Values above 100% indicate buyers are paying over list price, often in competitive markets.
Pending Home Sales
The count of signed purchase contracts that have not yet closed. This leading indicator typically forecasts closed-sale volume one to two months in advance.
Absorption Rate
How quickly available homes are sold in a market over a specific period. A high absorption rate indicates strong demand relative to supply.
Reading the Market Direction
No single indicator tells the whole story. A rising median price alongside climbing inventory and longer days on market can suggest that prices haven't caught up with a softening in demand - a pattern that often precedes broader cooling. Conversely, falling inventory with stable or rising prices and a shrinking DOM points toward continued seller advantage.
Mortgage rates, while not a local housing metric per se, are critical context. Rate changes directly affect purchasing power and can shift buyer demand faster than inventory can respond. When rates rise sharply, pending sales often dip within weeks even if closed-sale data looks healthy for another month or two.
Local conditions vary significantly from national averages. A metro area can be cooling even as national headlines report price growth - or vice versa. For signals specific to your area, look at whether listing price reductions are becoming more common, whether homes are sitting longer, and whether new listings are outpacing sales. Our article on signals that a local market is cooling breaks down these patterns in detail.
Understanding where the market sits within a longer cycle also adds valuable context. Real estate moves in cycles, and the same indicator can mean different things depending on the phase. Before making any major housing decision, consider building a habit of tracking these metrics over time - our practical market-tracking checklist offers a structured starting point.
The content on this site is provided for informational purposes only and should not be considered a substitute for professional advice. While we strive to provide accurate and up-to-date information, we make no guarantees regarding its completeness or accuracy. Always consult a qualified professional for advice specific to your circumstances before making any decisions.