
Median Price vs. Average Price: Which Housing Stat Should You Trust?

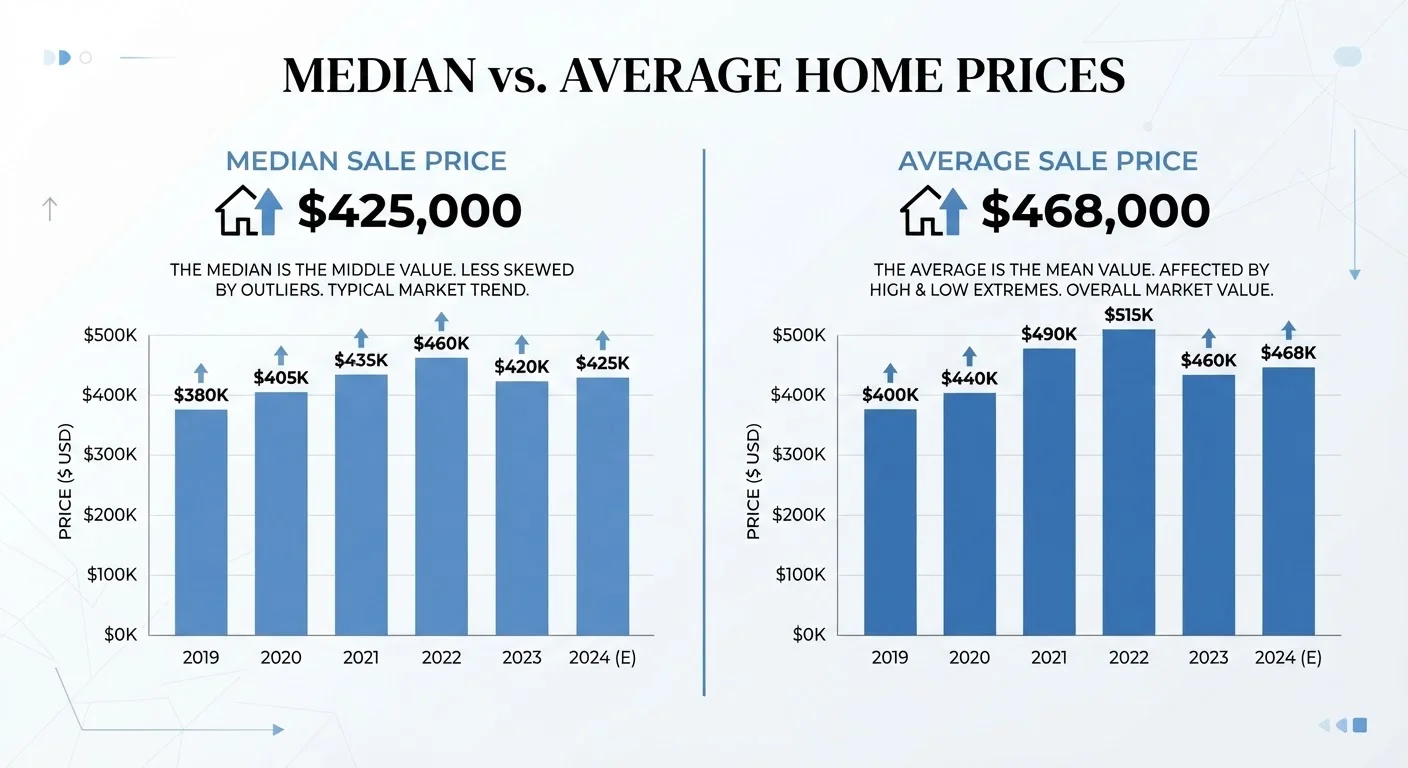
Photo: TheSearchHound.com | One Stop Answer To All Your Questions editorial
Key Takeaways
- Median price reflects the midpoint of all sales - half sold for more, half for less.
- Average price is pulled upward by a small number of very expensive home sales.
- In markets with luxury properties, median is typically a more reliable indicator for typical buyers.
- Both metrics have legitimate uses - context determines which one is more informative.
- Local market conditions can make national price figures misleading for individual buyers.
What Each Statistic Actually Measures
When you read that the national median home price is $400,000, that means exactly half of all homes sold for less than that figure and half sold for more. It is a positional measure - it finds the literal midpoint of a dataset, regardless of how extreme the values at either end are.
The average (mean) price works differently. Add up every sale price in a market and divide by the number of transactions. A single $5 million estate sale in a predominantly middle-class neighborhood can push that average significantly higher - even if every other home sold for under $350,000.
This distinction is not academic. It changes what the number actually tells you. For context on how these figures fit into the broader set of market signals, see Housing Market Indicators Every Reader Should Know.
| Criterion | Median Home Price | Average (Mean) Home Price |
|---|---|---|
| Definition | Middle value in a ranked dataset | Sum of all prices divided by number of sales |
| Sensitivity to outliers | Low - outliers don't shift it significantly | High - luxury sales pull it upward |
| Best reflects | Typical buyer's market experience | Total market dollar volume |
| Used most by | NAR, Zillow, Redfin consumer reports | Economists, aggregate market analysts |
| Reliability in mixed markets | High - stable across price tiers | Lower - skewed by luxury tier activity |
| Usefulness for buyers | High - practical budgeting benchmark | Moderate - context-dependent |
Why Luxury Sales Skew the Average
Real estate markets are not evenly distributed. In almost every metro area, a small percentage of properties - ultra-luxury homes, historic estates, waterfront properties - sell for prices that are multiples of the typical home. These outliers drag the average upward without reflecting the experience of the vast majority of buyers and sellers.
Consider a simplified example: nine homes sell for $300,000 each, and one sells for $3 million. The median is $300,000 - accurate for most participants. The average comes out to $570,000 - a figure no actual buyer in that market likely encountered. This is why professional real estate economists and the National Association of Realtors commonly lead with median price as the primary benchmark.
~15-20%
Typical gap between median and average home prices
In markets with active luxury segments, average prices commonly run 15-20% above median prices, according to housing economists' general observations of US metro data.
Top 5%
Share of sales that disproportionately influence averages
Research on income and wealth distribution consistently shows that the top tier of any asset market exerts outsized influence on mean calculations while leaving medians relatively stable.
Understanding this skew matters especially when evaluating whether a market is truly moving. If average prices rise sharply but median prices remain flat, it may signal increased activity at the luxury tier rather than broad-based appreciation. The supply and demand dynamics behind pricing make these distinctions even more consequential.
When Average Price Is the Right Tool
Average price is not without value - it depends entirely on what question you are trying to answer. For aggregate market analysis, economists use average prices to calculate total market transaction volume. Multiply average price by total sales to get total dollar volume for a period - a figure that reveals whether market activity is expanding or contracting in real terms.
Average prices also help when comparing markets where the luxury segment is relatively consistent. In a dense urban condo market with little variation in unit size, average and median tend to converge, making either figure reasonably reliable. But in markets where lot sizes, age of housing stock, and property types vary widely, the gap between mean and median widens considerably. For a full framework on reading these reports, see Reading a Housing Market Report Without Getting Lost.
Price Per Square Foot: A Useful Third Metric
Applying the Right Metric to Your Decision
For most everyday buyers and renters evaluating affordability, median price is the more practical figure. It represents the realistic midpoint of what is available and what transactions are actually occurring. When paired with local inventory data and days-on-market figures, median price gives you a grounded starting point for budgeting and offer strategy.
That said, neither number tells the full story on its own. National medians rarely reflect local realities - home prices don't move the same way everywhere, and a headline figure for the US as a whole may have little bearing on a specific ZIP code. Similarly, if you are deciding between renting and buying, raw price statistics need to be weighed against carrying costs, local rent levels, and your own financial position. Renting vs. Buying in a High-Price Market explores those trade-offs in detail.
The most informed readers treat both statistics as complementary signals rather than competing truths - using median as the primary benchmark and average as a secondary check on overall market composition.
The content on this site is provided for informational purposes only and should not be considered a substitute for professional advice. While we strive to provide accurate and up-to-date information, we make no guarantees regarding its completeness or accuracy. Always consult a qualified professional for advice specific to your circumstances before making any decisions.