
Things People Get Wrong About Falling Home Prices

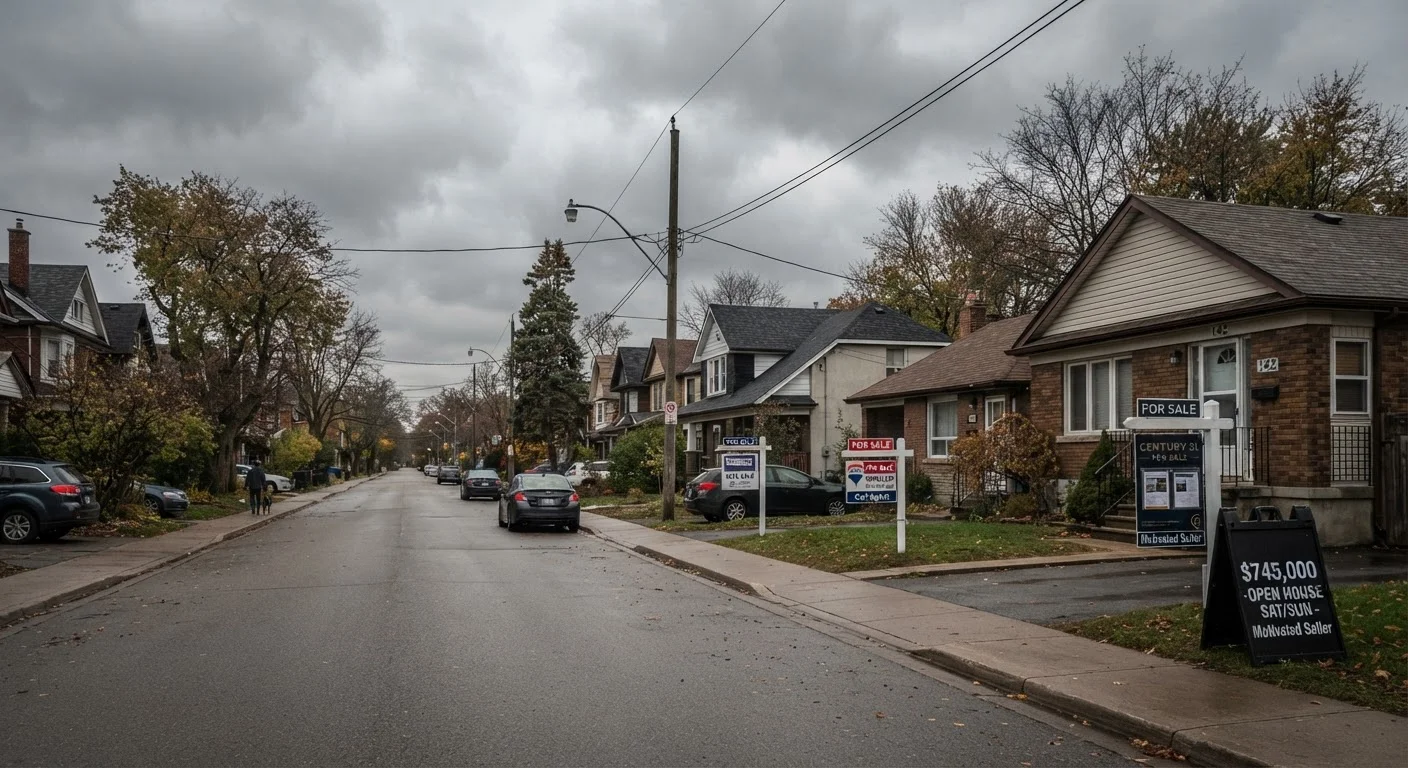
Photo: TheSearchHound.com | One Stop Answer To All Your Questions editorial
Key Takeaways
- A price decline in one market does not mean national home values are collapsing.
- Falling prices can reflect normal market corrections, not necessarily a housing crisis.
- Affordability and price are different measures - lower prices don't always mean homes become more affordable.
- Sellers reducing list prices is not the same as completed sales prices falling significantly.
- Local supply, employment, and migration patterns drive prices far more than national trends.
Why Housing Price Headlines Mislead So Many Readers
When a housing market headline announces that home prices are falling, the immediate instinct for many readers is alarm - or opportunity. Both reactions can be premature. Housing price data is layered, geographically uneven, and easy to misread without context. Understanding what price movements actually mean is essential before making any decision based on them.
The myths below are among the most common and consequential misreadings of housing market data. For a broader foundation, see how real estate moves in cycles - understanding where the market sits in that cycle is what gives any price news its real meaning.
Myth
Falling home prices mean the housing market is crashing.
Fact
Price declines are a normal part of the housing cycle and don't automatically signal a crash or systemic crisis.
A crash implies a rapid, deep, and broadly damaging collapse - often accompanied by widespread foreclosures, frozen credit markets, and economic fallout. A price correction, by contrast, is a more modest pullback after a period of overheating. Many markets experience periodic corrections without long-term damage to homeowners or the broader economy. Treating every dip as a catastrophe misreads how real estate markets have historically behaved.
Myth
If prices fall, buying a home automatically becomes more affordable.
Fact
Affordability depends on price, mortgage rates, income, and carrying costs together - not price alone.
A home that drops 8% in list price while mortgage rates rise by a full percentage point may actually cost the buyer more per month than before the price fell. Property taxes, homeowners insurance, and maintenance costs also factor into true affordability. Focusing only on price ignores the full cost of ownership that determines whether a purchase is genuinely within reach.
Myth
National home price data tells you what's happening in your local market.
Fact
National averages mask enormous variation - some local markets rise while others fall simultaneously.
The US housing market is not one market. It is thousands of distinct local markets influenced by local employers, zoning rules, population trends, and regional economic conditions. During periods when national data shows modest price growth, individual metros can be experiencing double-digit declines or gains. Relying on national figures to make a local buying or selling decision is one of the most common and costly mistakes in residential real estate.
Myth
Price reductions on listings mean sale prices are dropping sharply.
Fact
List price cuts reflect seller strategy adjustments, not necessarily a collapse in what buyers actually pay at closing.
When sellers reduce their asking prices, it often signals that properties were initially overpriced for current demand - not that the market is in freefall. The relevant figure for understanding true market value is the final sale price, and specifically how it compares to similar recent sales. A rise in the share of listings with price cuts is worth monitoring, but it's a leading indicator of softening conditions, not confirmation of a crash.
Myth
Rising home prices always indicate a bubble about to burst.
Fact
Price growth driven by genuine supply shortages and strong demand is fundamentally different from speculative bubble conditions.
A bubble typically involves prices detached from economic fundamentals - driven by speculation, easy credit, and expectation of quick resale profit rather than actual housing need. When prices rise because housing supply is structurally constrained and population or job growth is increasing demand, that growth has a real foundation. Not every period of price appreciation ends in a bust; context about the underlying drivers matters enormously.
What Price Movements Actually Tell You - and What They Don't
Even when price data is accurate, it rarely tells you what to do next. A 5% price decline in a metro that saw 40% gains over three years is a correction, not a collapse. A 3% gain in a market with stagnant wages and rising insurance costs may offer no real improvement in household affordability.
~400
Distinct local housing markets tracked in the US
Housing economists commonly analyze hundreds of individual metro-level markets, each with its own supply and demand dynamics distinct from national trends.
1 pp
Rate rise that can offset an 8-10% price drop
Industry affordability models consistently show that a one-percentage-point increase in mortgage rates can erode the monthly savings from a meaningful home price decline.
~18 months
Typical lag between rate changes and price response
Research from housing economists suggests home prices often take 12-18 months to fully reflect significant changes in mortgage rates or economic conditions.
The most important habit a buyer or seller can develop is distinguishing between national averages and local realities. As detailed in our analysis of why home prices don't move the same way everywhere, supply constraints, job growth, and migration flows shape local markets in ways that national data simply cannot capture.
For buyers specifically, price signals are only one input. First-time buyers frequently misread market conditions by focusing on price headlines rather than local inventory trends, days-on-market data, and their own financing position. And if you're watching for early signs of a shift in your area, learning to read signals that a local market is cooling gives you a more actionable picture than any national index.
Price Data Is Only One Piece of the Picture
Before drawing conclusions from any price report, ask: Which geography does this cover? What time period? Is this measuring list prices, sale prices, or median values? The answers change the story considerably. For a broader look at the homebuying process itself, the Buying a Home resource hub provides guidance on each stage of the purchase journey.
The content on this site is provided for informational purposes only and should not be considered a substitute for professional advice. While we strive to provide accurate and up-to-date information, we make no guarantees regarding its completeness or accuracy. Always consult a qualified professional for advice specific to your circumstances before making any decisions.