
Price Tracking Tools and How They Work

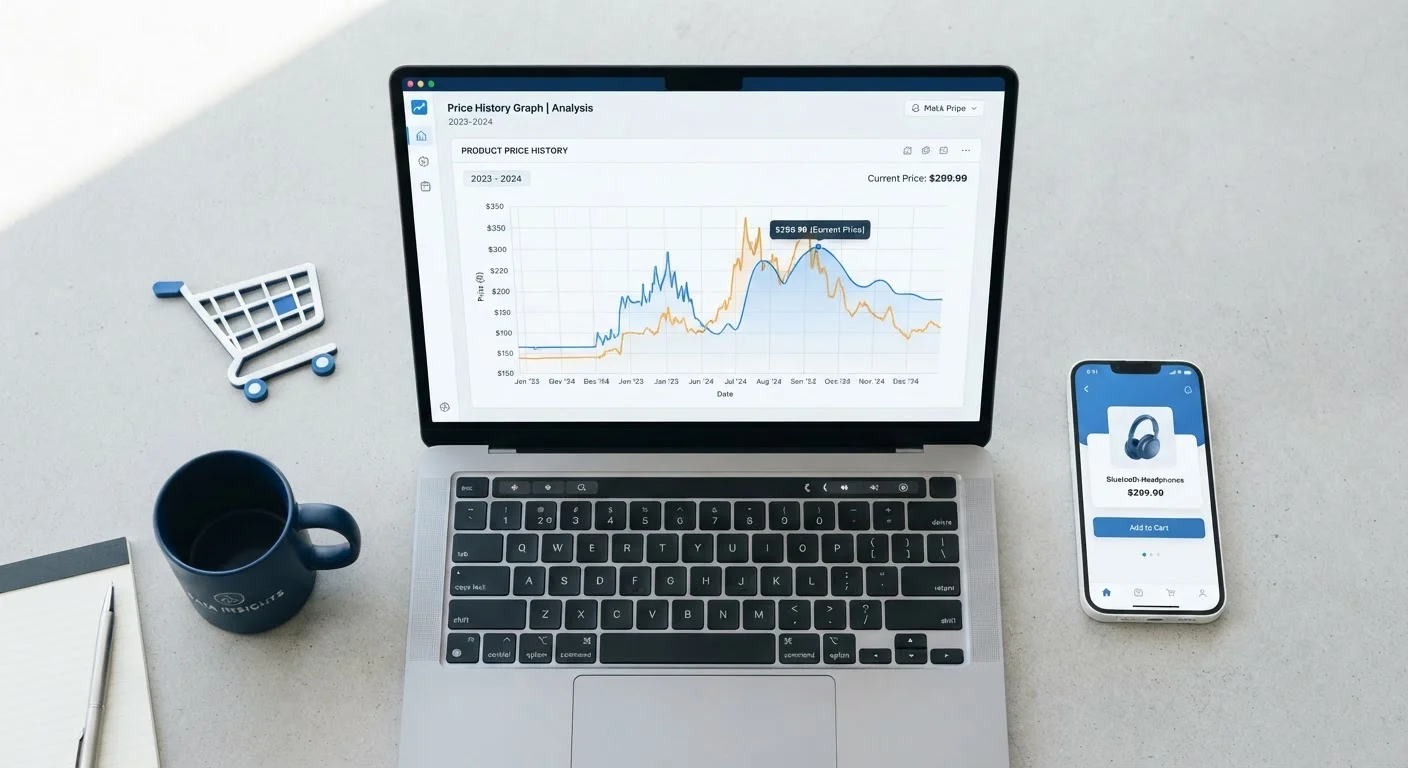
Photo: TheSearchHound.com | One Stop Answer To All Your Questions editorial
Key Takeaways
- Price trackers record historical pricing data so you can see whether a "sale" price is actually lower than the norm.
- Retailers frequently raise prices before promotional events, making trackers a useful reality check.
- Price history alone doesn't tell the whole story - stock levels, seller changes, and condition variations can affect readings.
- Setting a price alert lets you act when a product dips to your target without monitoring it manually.
- Cross-referencing tracker data with known seasonal markdown cycles adds useful context to your decision.
What Price Trackers Actually Do
At their core, price tracking tools are automated monitors. They periodically visit a product's listing page, record the price shown, and log it to a database. Over days, weeks, or months, those logged prices form a historical chart. When you view that chart, you can see exactly how much a product has cost at different points - not just what a retailer tells you it was worth before a markdown.
This matters because "original price" claims on retail sites are not always anchored in reality. A product listed at a steep discount may have spent very little time at its stated original price. A tracker's historical graph makes these patterns visible at a glance.
Most tools also let you set a price alert - a notification sent when the tracked price drops to or below a threshold you define. This removes the need to check manually and lets you act on real price movement rather than promotional messaging. For a broader look at how to evaluate what you're actually paying over time, see what a product's total cost of ownership actually means.
~20%
Average pre-sale price inflation observed before major shopping events
Analysis of retailer pricing patterns by consumer research groups has found prices on popular items are commonly raised in the weeks before promotional shopping events, reducing the real value of the stated discount.
Daily
Typical frequency most price trackers check product listings
Most mainstream price tracking tools refresh pricing data once per day, meaning very short flash sales may not always be captured in the historical record.
Reading a Price History Graph
A typical price history chart displays time on the horizontal axis and price on the vertical axis. Steady flat lines indicate stable pricing. Sharp spikes upward often precede promotional events - a retailer raising the listed price before announcing a "sale" that returns it to near its original level. Gradual downward slopes may reflect genuine markdown trends as a product ages or newer versions arrive.
A few things to watch for when reading these charts:
- Pre-sale price inflation: A sudden price increase one to two weeks before a major shopping event is a common pattern. The subsequent "discount" may simply return the price to where it was before.
- Floor price: The lowest point in the chart's history gives you a realistic sense of how low the price has previously gone. This is a more honest benchmark than any retailer's stated "original" price.
- Seller changes: If the item is sold by multiple vendors on a marketplace, a price drop may reflect a switch to a different seller rather than a genuine markdown by the same one.
Understanding these patterns pairs well with knowing when categories typically go on genuine markdown cycles. Seasonal sales cycles can help you contextualize what the tracker's graph is showing.
Limitations Worth Knowing
Price trackers are useful tools, but they have real constraints that affect how you should interpret the data.
Coverage gaps: Most trackers work well on large platforms but have limited reach on smaller or regional retailer sites. If a better price exists somewhere the tool doesn't monitor, you won't see it reflected in the comparison.
Condition and listing changes: A listed price may drop because the product condition changed (open-box vs. new), the listing was reformatted, or a bundle was altered. The tracker records the number without always capturing why it changed.
Scraping limitations: Some retailers serve different prices to different users or block automated checks. This can create gaps or inconsistencies in the historical record.
For situations where you've found a lower price - whether through a tracker or elsewhere - it's also worth understanding how retailer price-matching policies work. Price matching rules and how to ask vary significantly between stores and aren't always advertised clearly. Similarly, comparing what online trackers show versus in-store pricing deserves its own scrutiny - see in-store deals vs. online prices for context on where assumptions tend to go wrong.
Set Your Target Price Before You Start Tracking
Frequently Asked Questions
The content on this site is provided for informational purposes only and should not be considered a substitute for professional advice. While we strive to provide accurate and up-to-date information, we make no guarantees regarding its completeness or accuracy. Always consult a qualified professional for advice specific to your circumstances before making any decisions.